The amount of traffic your server is receiving is an important metric for any sysadmin to watch. There are software available that make it easy to read compiled graphs using your web server’s access log. One such software is GoAccess. We will learn about GoAccess in this article.
Use your log files
Whenever someone accesses your web server, a new line entry is created in your web server’s access log. Typically, the client’s IP address and the request they made are logged, as well as the response code, what date and time it was accessed, and other information about the request.
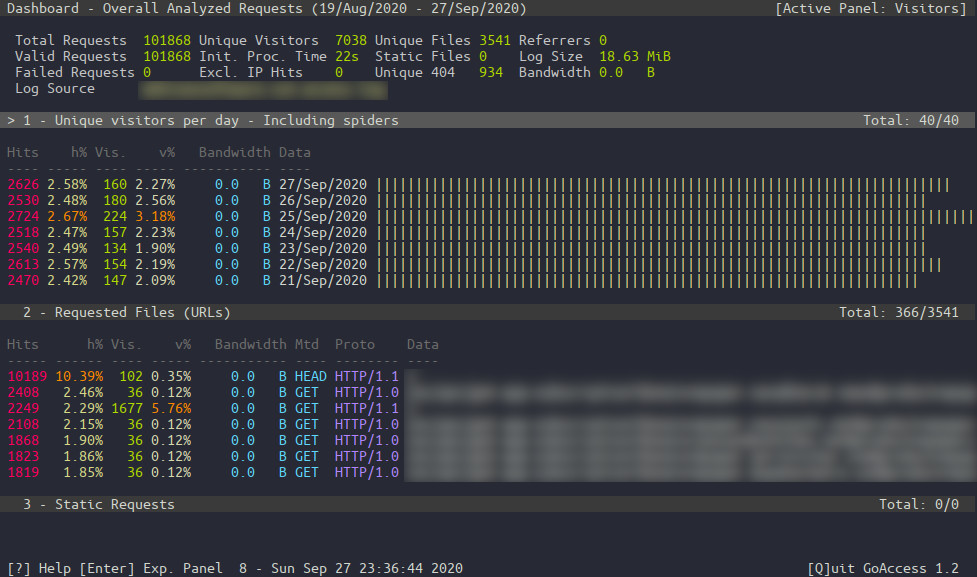
Reading log files is a difficult task, but there are software available that can monitor server health using log files. GoAccess is a popular open-source tool for this task. It can run in a terminal, and displays useful statistics based on your log entries. It can track the total number of visits per day, and can also tell which pages are receiving the most traffic.
GoAccess also provides a web interface, this interface provides much more detailed information. If you access it from web interface, it will show real-time graphs tracking every single visit. From web interface, visitors with the same IP, date and agent can be grouped into unique visitors.
GoAccess is free and open source software. But it is designed for a single server. If you have more than one server, you will have to run more than one instance of GoAcccess. Or you can also use Apache Top or Nginx Status Module. If you want to monitor the CPU and memory consumption of your server, then you should use Monit.
Installing GoAccess
Go access is extremely easy to install. You can install it through your package manager. In Ubuntu and Debian-based distributions it can be installed by using the following command:
apt-get install goaccess Now you have to locate your server’s access log files. They are usually found within the / var / log folder. Apache’s file /var/log/apache2/access.log and nginx’s log file can be /var/log/nginx/access.log here.
Now give this command on the terminal:
goaccess /var/log/nginx/access.log 
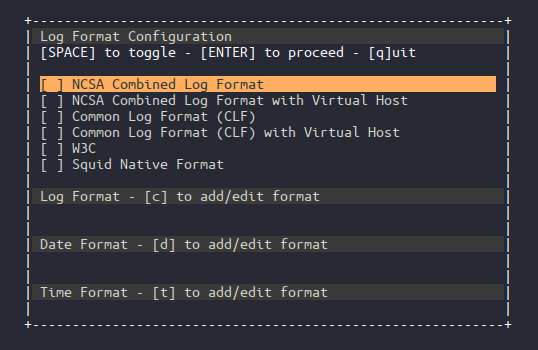
Now you will be asked the format of the log file. You choose the appropriate format in it. Common Log Format usually works for both. After this, you will see a report on all the hits coming to your server.

If you want to see this report on the web interface, order as follows:
goaccess /var/log/nginx/access.log -o /var/www/html/report.html --log-format = COMMON --real-time -html The report.html in the above command should be located in a folder that you can access from the browser via http request. But for security purpose it must be protected by Basic Authentication.
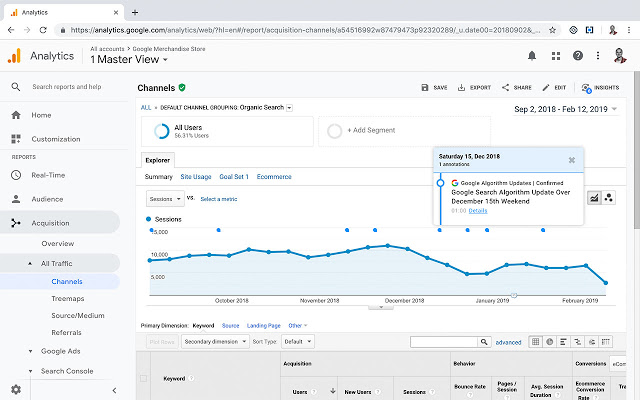
If you want to get more information about the traffic of your websites, then I would suggest that you should use an analytics tool. Like Google Analytics or Open Source Matomo Analytics .


